


背景和目标(Linux系统安装和基本使用)
一生一芯项目的预学习阶段二,PA0中存在一个关于GDB的小任务,主题为如何在Linux上调试C或C++程序,本文章是该部分的学习笔记。
当我们使用vscode和vs之类的软件时,它们可以帮助我们很轻松的给程序打上断点,然后观察程序内的变量,这是因为vscode或者vs调用了GDB或者类似的应用,我之前注意到,使用GDB去运行程序会进入一个命令行界面,这表明GDB是通过和Bash或者python类似的命令去调用的,不过我从来没有再GDB的cli里去调试过程序。
通过阅读本笔记,你将会学会
- 如何安装GDB
- 编写一个存在除零错误的C语言程序
- 使用GDB分析生成的核心转储
本教程基于ubuntu server 24.04环境实现
安装GDB
对于Debian系的操作系统(如Kali,Ubuntu),可以使用apt包管理器直接安装,确保你的网络是正常的,如果无法安装,建议检查源
sudo apt install gdb build-essential gcc编写程序
我们使用vim来编写我们的程序,输入下面的内容
vim test.c在test.c中加入如下内容并保存
int actual_calc(int a, int b){
  int c;
  c=a/b;
  return 0;
}

int calc(){
  int a;
  int b;
  a=13;
  b=0;
  actual_calc(a, b);
  return 0;
}

int main(){
  calc();
  return 0;
}
这是一个非常简单的程序,其中藏着一个错误,当main函数调用calc函数,calc再调用actual_calc函数,然后触发一个除零错误。
使用gcc命令编译之后,我们执行可执行文件,可以发现程序报了Floating point exception错误,根据教程中所说,并不存在core dump信息,我们在/etc/sysctl.conf系统配置文件中写入core_pattern信息并重新加载。
if ! grep -qi 'kernel.core_pattern' /etc/sysctl.conf; then
  sudo sh -c 'echo kernel.core_pattern=core.%p.%u.%s.%e.%t >> /etc/sysctl.conf'
  sudo sysctl -p
fi
ulimit -c unlimited
使用gdb进行分析
重新执行文件,可以发现在当前目录下生成了一个核心转储文件,我们使用gdb来分析这个核心转储文件。
下面的命令将会加载可执行程序和核心转储文件
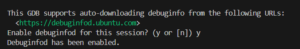
gdb <可执行文件> <核心转储文件>这里可能会遇见gdb问是否要debuginfod,启用这个功能后可以看到程序中的更多信息,比如源码所在的行数,我们可以输入y
GNU gdb (Ubuntu 15.0.50.20240403-0ubuntu1) 15.0.50.20240403-git
Copyright (C) 2024 Free Software Foundation, Inc.
License GPLv3+: GNU GPL version 3 or later <http://gnu.org/licenses/gpl.html>
This is free software: you are free to change and redistribute it.
There is NO WARRANTY, to the extent permitted by law.
Type "show copying" and "show warranty" for details.
This GDB was configured as "x86_64-linux-gnu".
Type "show configuration" for configuration details.
For bug reporting instructions, please see:
<https://www.gnu.org/software/gdb/bugs/>.
Find the GDB manual and other documentation resources online at:
    <http://www.gnu.org/software/gdb/documentation/>.

For help, type "help".
Type "apropos word" to search for commands related to "word"...
Reading symbols from ./test.out...
[New LWP 406058]
--Type <RET> for more, q to quit, c to continue without paging--

This GDB supports auto-downloading debuginfo from the following URLs:
  <https://debuginfod.ubuntu.com>
Enable debuginfod for this session? (y or [n]) y
Debuginfod has been enabled.
To make this setting permanent, add 'set debuginfod enabled on' to .gdbinit.
Downloading separate debug info for system-supplied DSO at 0x7ffd5efa9000
[Thread debugging using libthread_db enabled]
Using host libthread_db library "/lib/x86_64-linux-gnu/libthread_db.so.1".
Core was generated by `./test.out'.
Program terminated with signal SIGFPE, Arithmetic exception.
#0  0x000058d47fdc613b in actual_calc (a=13, b=0) at test.c:3
3         c = a / b;
我们可以看到gdb最后给我们的提示是程序退出并给出了SIGFPE错误,这是一个算术异常,同时gdb提示我们出错的地方位于test.c的第三行,代码为 c = a / b;,而a=13,b=0。
分析函数调用
在gdb中的frame就像只能执行一个函数的线程,比如这里的#0,指的是错误发生在actual_calc这个函数中。我们使用bt(backtrace)命令去追踪函数的调用过程
(gdb) bt
#0  0x000058d47fdc613b in actual_calc (a=13, b=0) at test.c:3
#1  0x000058d47fdc6171 in calc () at test.c:12
#2 0x000058d47fdc618a in main () at test.c:17可以看到,这里的trace应该是从最下面开始,的,程序先是执行了位于17行的main函数,然后main函数又去调用了calc函数,calc函数调用了actul_calc函数。
我们可以使用frame和list命令查看程序正在执行的源码,比如使用下面的命令切换到函数calc(#1)
frame 1然后使用list命令
list可以看到程序的输出如下
(gdb) frame 1
#1  0x000058d47fdc6171 in calc () at test.c:12
12        actual_calc(a, b);
(gdb) list
7       int calc() {
8         int a;
9         int b;
10        a = 13;
11        b = 0;
12        actual_calc(a, b);
13        return 0;
14      }
15
16      int main() {
检查变量值
在vs等IDE中,一般可以查看变量的值,在gdb中,我们可以像python一样,直接打印某个变量或者表达式的值
(gdb) print a
$1 = 13
(gdb) print b
$2 = 0
(gdb) print a/b
Division by zero
(gdb) print a*b
$3 = 0
(gdb) print a*(b+3)
$4 = 39
Comments NOTHING